Investment Dashboard

What is an investment dashboard?
The investment dashboard is an integrated panel for tracking, reconsidering, and scaling the performance of investments of the organization. This panel allows the monitoring of investment records following fixed and variable incomes. The process is administrated by an organization’s finance department under the chief financial officer’s(CFO) guidance. Investment dashboard services summarize investment records. These services are given by the advisory and consulting firm.
Organizations that sell customized planning services often offer simple investment dashboards to engage their users. The reason dashboard is a must-have is its hypercritical use for modern investors.
What do you look for in an investment dashboard?
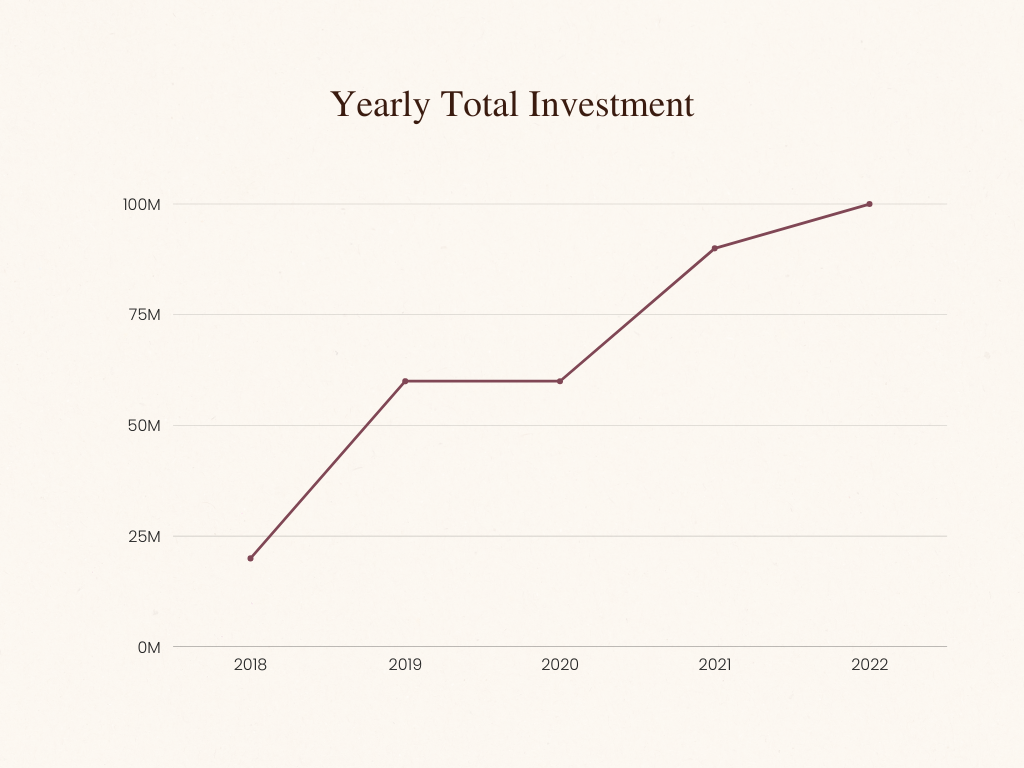
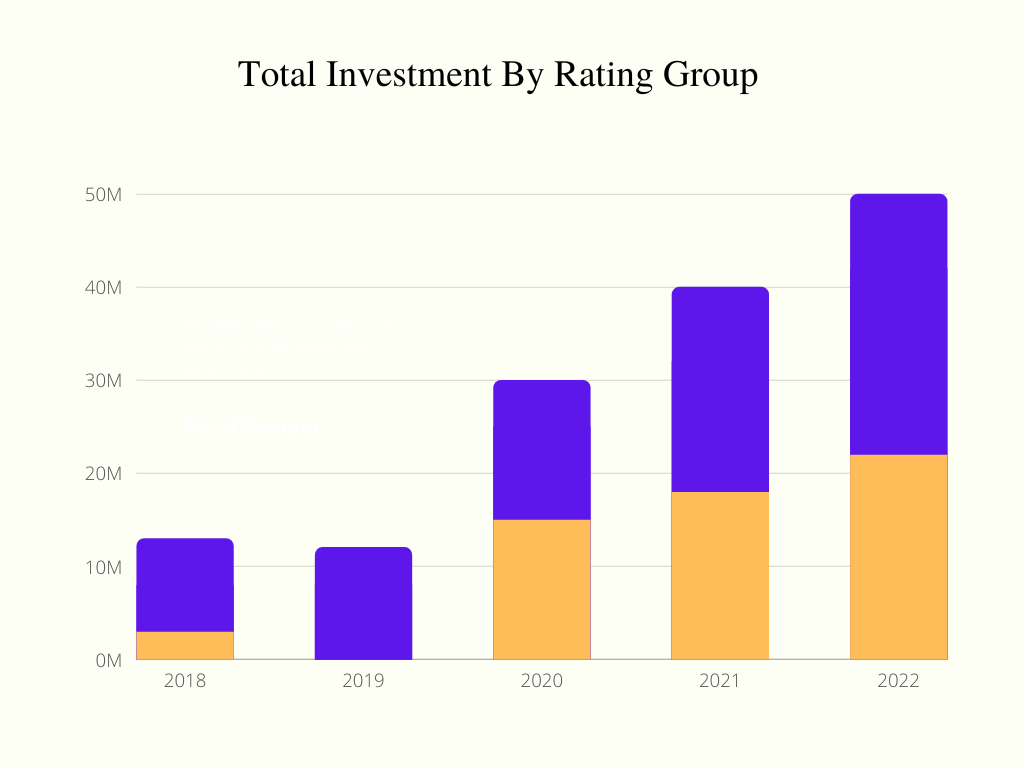
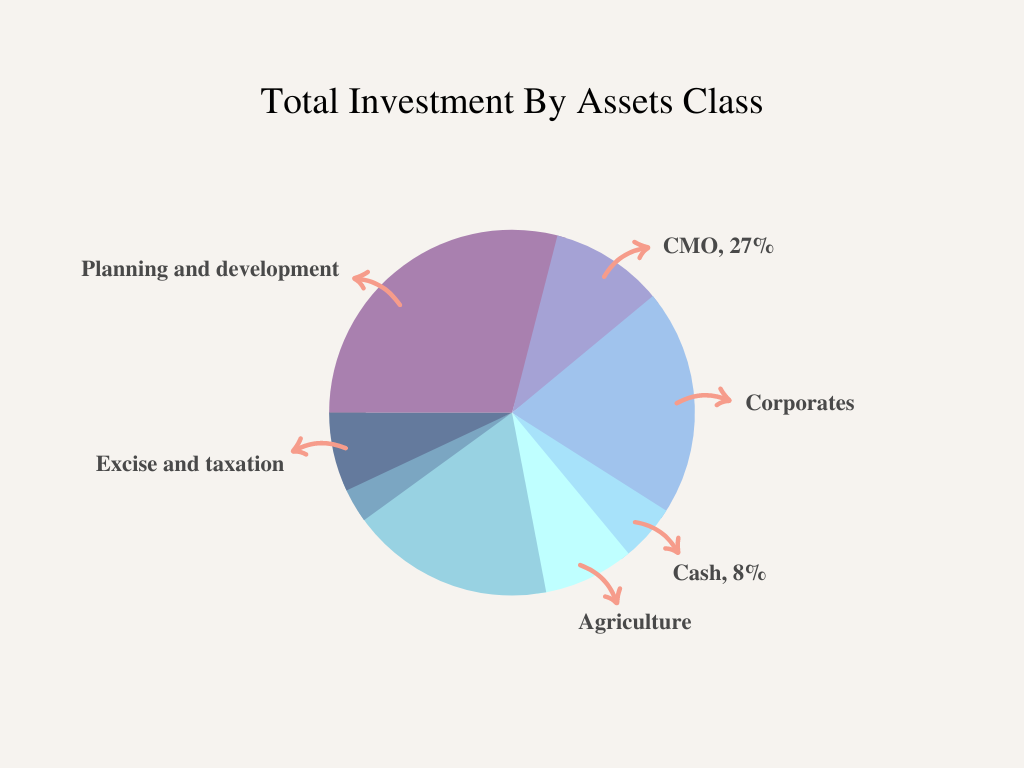
Yearly investment trends, division of asset classes, and investment concentration are some important things that are available in this dashboard.
Why does it matter?
This dashboard assists the financial department in analysis and decision-making regarding the organization’s future short and long-term goals. It provides insight into how your assets play a role in impacting your company’s net worth. A clear viewpoint of investment is necessary to set more accurate goals.
Get a conception of financial life and portfolio variation:
A key goal of dashboard is to make your investments, account, and other asset types visible and reachable. Any asset bringing down your progress will be spotted and cleared out when you have a transparent portfolio.
Get more precise goals and forecasts:
A clear view of your investments and assets is key to understanding individual and overall asset performance. you will be prepared to create more accurate reports, build out forecasts, and set achievable future goals once you have a realistic understanding of performance.
Is the investment dashboard necessary only for the financial department?
This dashboard is not only for the financial department but other departments within the company can also use the dashboard for business such as the sales department.
The key measure of organizational investment
Return on investment(ROI) is a key measure of an organization’s investment performance. Return on investment is a performance measure of a company’s profitability of the investment. It is measured by dividing net income divided by the capital cost of investment and the investment dashboard allows for measuring return on investment(ROI). The higher ratio of ROI means that a greater benefit is earned.
What does the dashboard summarize?
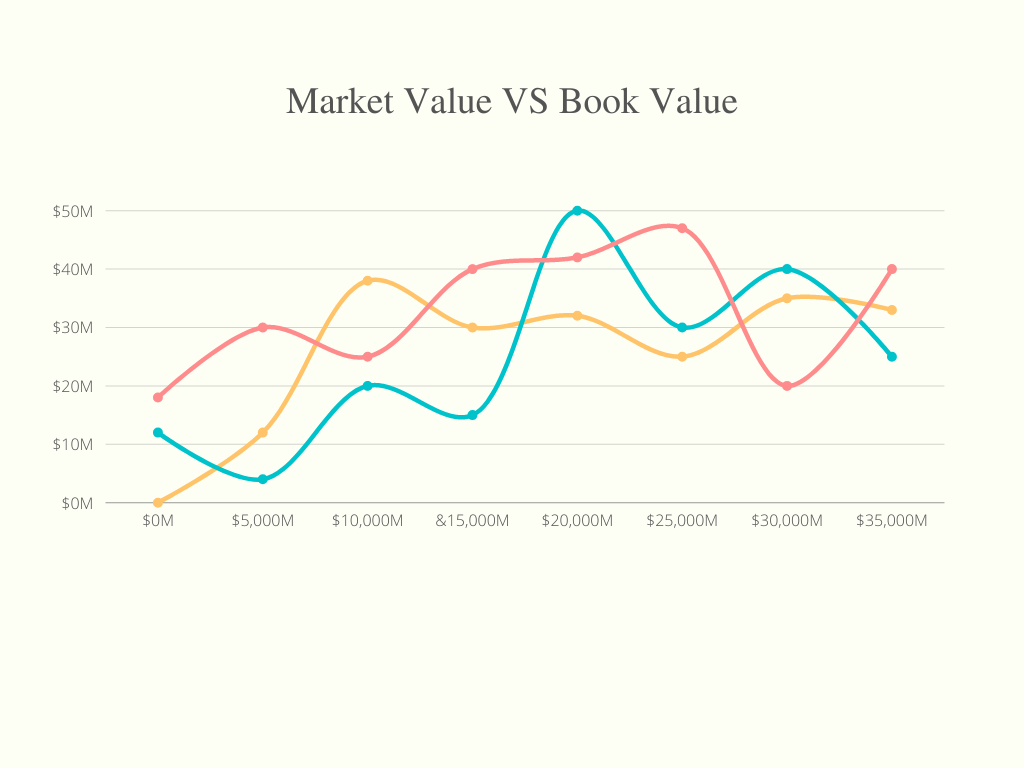
The dashboard summarizes total holdings, potential profits, rate of return, and daily gains or losses.
Uses of investment dashboard
There are many applications, here I would like to describe a few.
1. Check the dashboard for your intended investment company before you make decisions regarding investment. Value the operation status of your investment target using the dashboard.
2. After making investment actions, use the dashboard to keep track of up-to-date investment conditions. If the investment situation is good, you can continue to invest. Otherwise, stop investing, it is a loss of time. Make your investment strategy again.
3. Almost all departments within the company can use an investment dashboard for relevant business.
How to create a dashboard
Here are key points for building an investor dashboard that helps to visualize the assets impacting your net worth performance.
Round up all accounts and assets
First, account for all your assets and liabilities that make your portfolio and affect your net worth. Assets may include cryptocurrencies, valuables, vehicles, real estate, cash, and stock accounts. In this process, this is the point where you use pencil and paper to track everything you own and owe.
Set your preferred currency
Next up, choose the preferred currency in which you like to see your portfolio.
Identify return on various investments
The internal rate of return calculator IRR is a detailed version of ROI that includes cash flow and holding time. Take advantage of it. Make sure all your assets are up to date.
View assets allocation and track net worth
Give a detailed view of asset allocation, asset performance, and net worth change over time using beautiful charts and graphs.
Developing software in the market
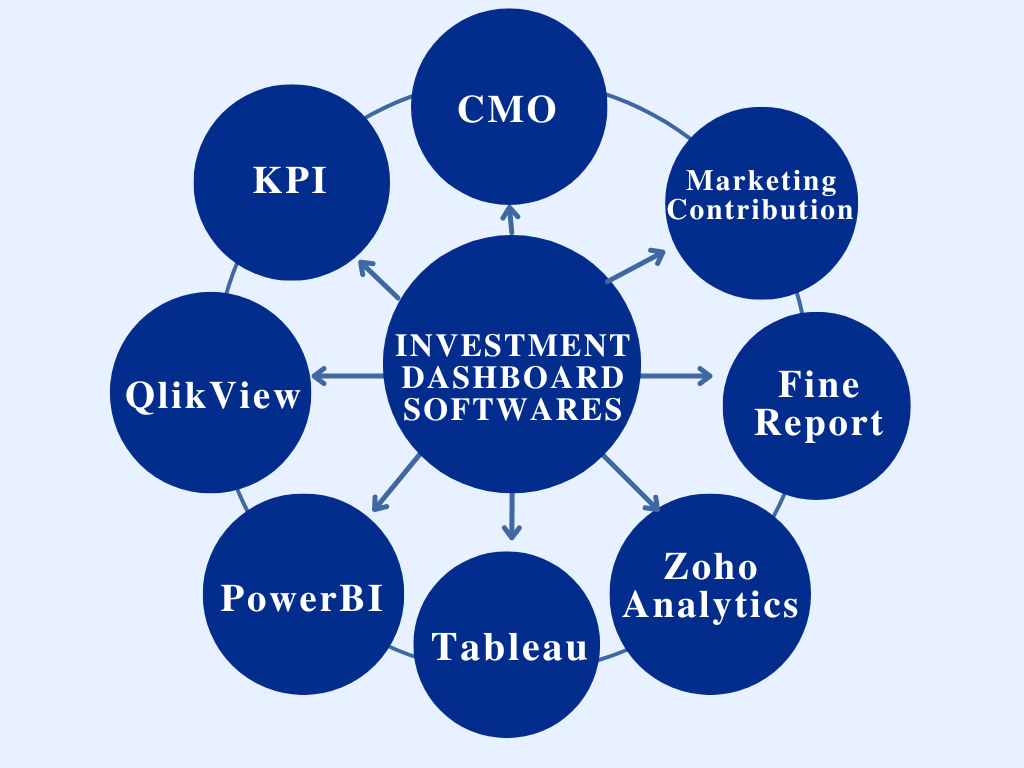
Several high-quality software are available in the market that aid in developing the best dashboards such as;
- QlikView
- KPI Dashboard
- CMO Dashboard
- Marketing Contribution Dashboard
- PowerBI
- Tableau
- Zoho Analytics
- FineReport
Golden Rule of investing:
“The greater the potential returns, the higher the level of risk”.
You May Also Like

Treasury Management
Treasury management is the management of enterprise holding. It is a key component of business operations. Treasury management services simplify business finance. It manages...

Working Capital Management
A business strategy planned to ensure that company operates smoothly by monitoring its current assets and liabilities to their effective use and maintaining sufficient cash flow to meet ...

Business Process Re-engineering
Business process reengineering is a management strategy and systematic approach to improve product quality and reduce organizational costs and services. Business process reengineering ...

Business Gap Analysis
A Business Gap Analysis is a strategic analysis tool that helps to identify the gap between two business states, expected and current, and comes up with an action plan to remove...
